Trend and Annual Index Information
Population trend estimates are the simplest measure of
population change over a time period. They are expressed
as a percent change per year, and in these Tables they
are presented for many regions (or species) and two time periods.
Please see the "Regional Credibility Measure" link to read the cautions regarding the quality of the estimates for regions with small sample sizes and low abundances.
Note that the end year of this example is 2010. This help file is also valid for 2011 and 2012 end years.
Here is the header and one line of data for a "typical"
trend output:
1. Regions (or Species)
This column defines the group for which the trend is defined. Regions presented in this analysis
are states, Provinces, Bird Conservation Regions (BCR), BBS Regions, Canada (excluding NF and YK), US (lower 48 states),
and Survey-wide (excluding data from Alaska and NF).
Bird Conservation Regions are used as the primary physiographic strata for the analysis.
BCRs were developed to provide a coherent spatial framework for conservation planning efforts
under the North American Bird Conservation Initiative (NABCI)
. These regions were derived from existing physiographic strata (see map and explanation at the Bird Studies Canada
BCR site.
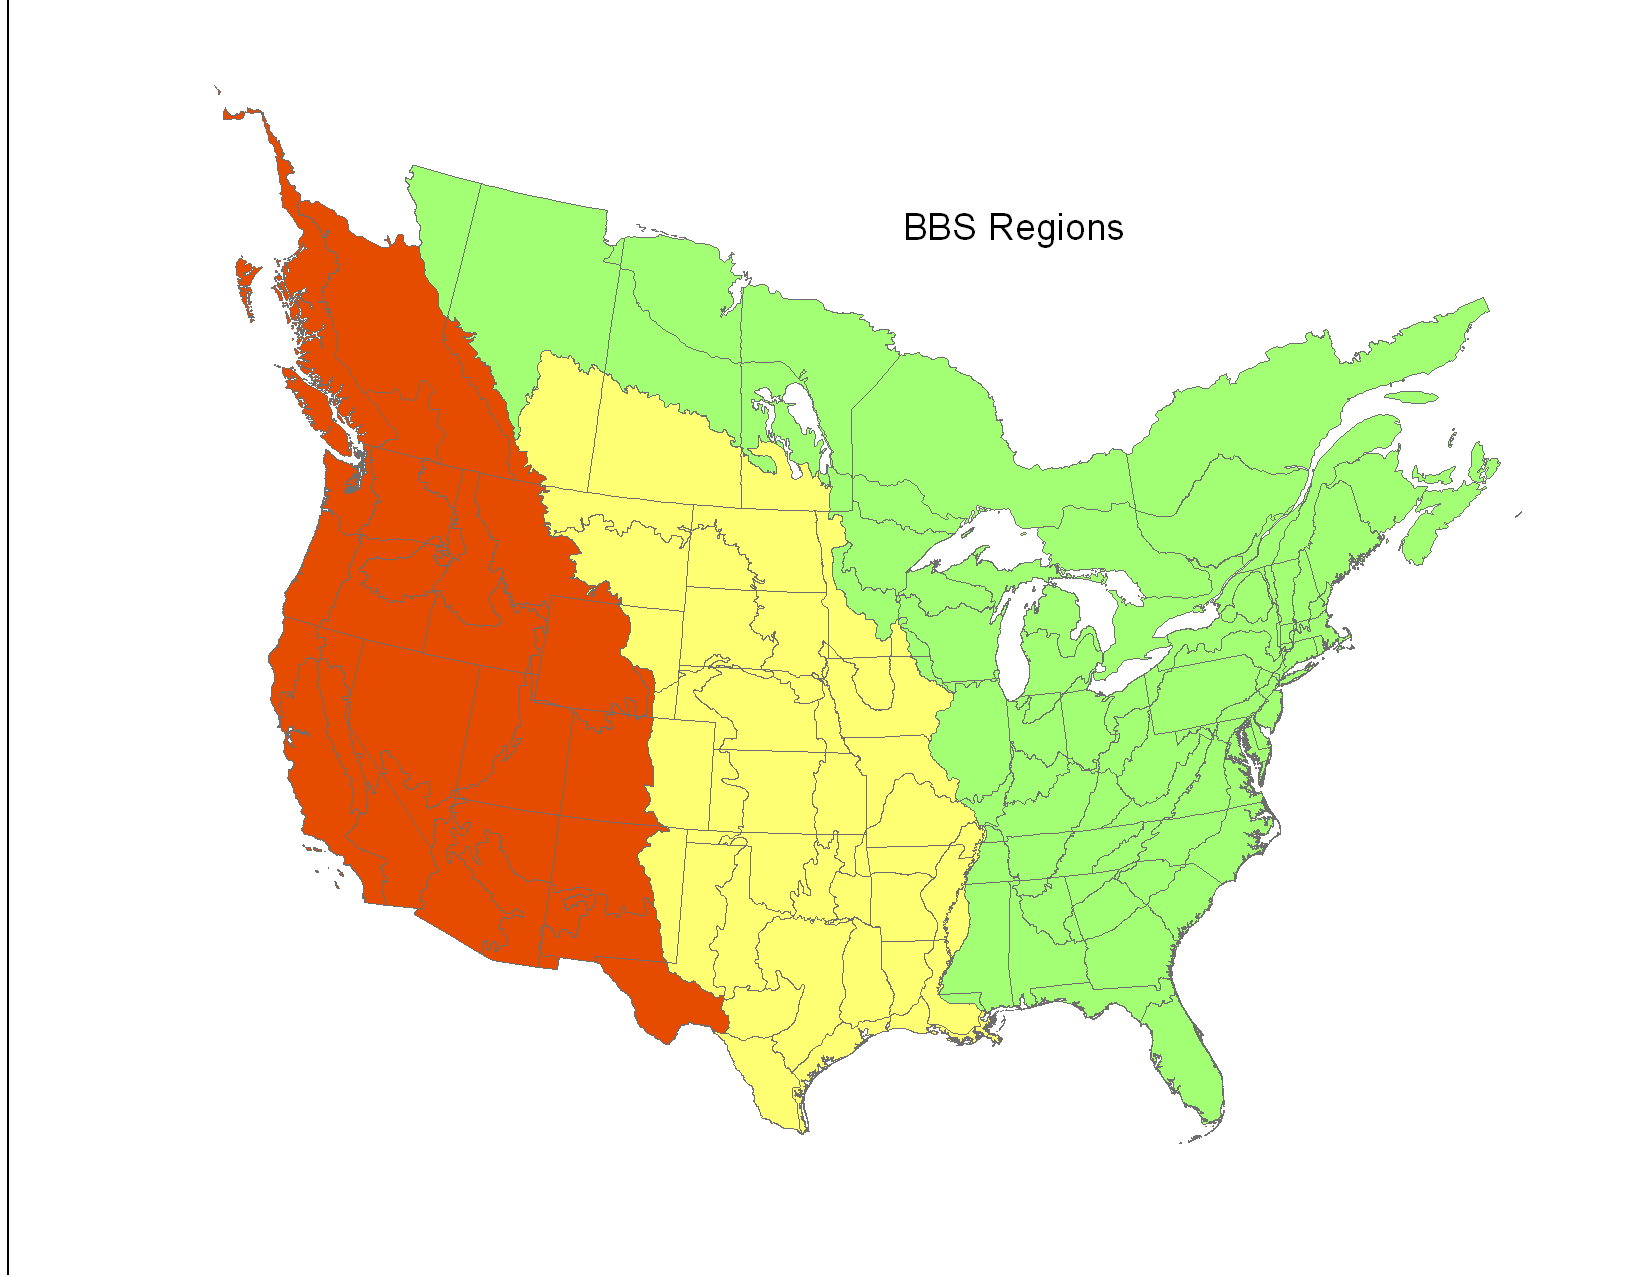
BBS regions are groups of physiographic strata.
The Eastern Region (EA) is composed of strata east of the Mississippi River in
the lower 48 US, but also includes forested strata in central Canada. The Central Region
(CE) extends from the Mississippi River to the edge of the Rocky Mountains.
The Western Region includes
all strata to the west of the Central and Eastern Regions. Note that Alaska,
Newfoundland, Yukon, and areas clearly to the north of the survey area are
not included in any regional summary. The BBS regions were first defined in a paper by
Danny Bystrak (Bystrak, D. 1981. The North American Breeding Bird Survey. Studies in Avian Biology 6:34-41,
Figure 1). The present regions cover similar areas, but exact boundaries are based on Bird Conservation Regions rather than the BBS physiographic regions used in earlier analyses. This map shows the regions as groups of BCRs (Green=Eastern, Yellow=Central, Red=Western).
2. Sample Size
This number represents the number of survey routes on which the species was encountered during the long-term (1966-2010)
interval. We note that earlier summaries of BBS data defined sample size slightly differently, as the number of routes for which trends could be calculated.
3. 1966-2010 Trend Estimates
These are trend estimates calculated as the ratio of endpoints from the annual indices produced in the
hierarchical model analysis (See 8, below). They are presented as a yearly percentage change.
4. 1966-2010 Credible Interval for Trend Estimate
These values represent the 2.5% and 97.5% percentiles of the posterior
distribution of trend estimates. These values replace the precision estimates and p values
presented in earlier analyses. If the credible interval does not contain 0, the result
could be judged significant, and in these tables significant long-term results are indicated by red (for declining populations)
or blue (for increasing populations) print. Results that are judged unreliable (red credibility index) are not highlighted by colors even if the CIs do not contain 0.
5. 1999-2010 Trend Estimates
These are trend estimates calculated as the ratio of annual indexes from 2010
and 1999, presented as a % change/year. This 10 year interval describes recent patterns of population change.
6. 1999-2010 Credible Interval for Trend Estimate
These values represent the 2.5% and 97.5% percentiles of the posterior
distribution of trend estimates. If the credible interval does not contain 0, the result could be judged significant. Note that short-term trends can be significant even if the long-term results are not; colored text only highlights long-term trends.
7. Relative Abundance
This value is the annual index (see 8, below) for the region from year 1988. The relative abundance estimate is model-based, produced as part of the hierarchical model analysis, and is adjusted for observer and other effects.
8. Annual Indexes
Annual indexes are linked to the region (or species) names. Clicking on the name will provide a
graphic of the annual indexes and their credible intervals. The indexes are relative abundance estimates for all years, estimated as yearly predicted abundances from the hierarchical model analysis. See Sauer and Link (2011, p. 89, col 2, para 4) for a precise definition of the indexes; a qualitative description of them is that they represent the mean count of birds on a typical route in the region for a year.
Note that the graphics were produced to ensure
that the annual indexes were visible with axes that permit observation of pattern in the indices.
This scaling occasionally cuts off extreme values in the upper credible intervals.