
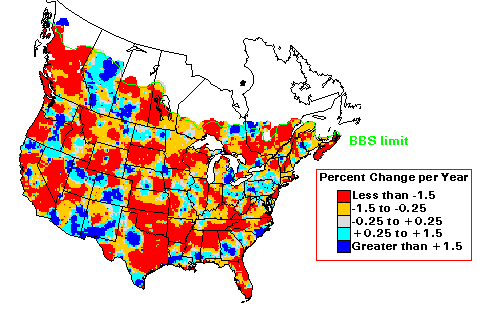
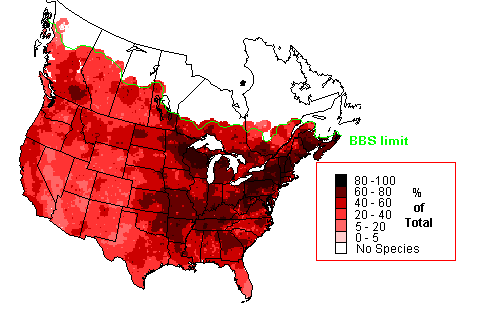
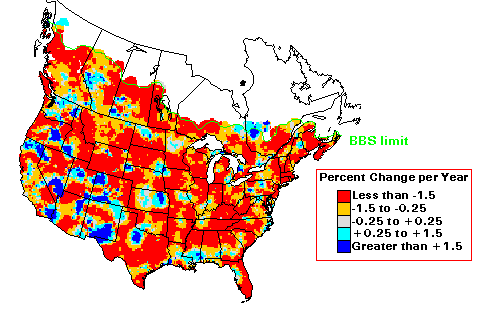
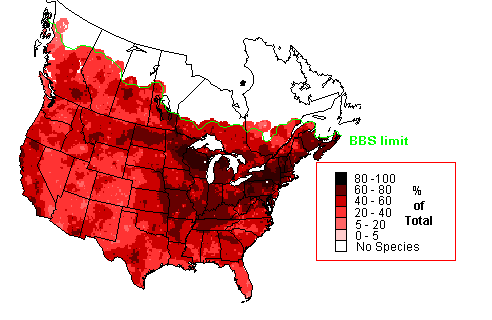
Summaries of Bird Population ChangeOverall, it appears that 51.5 % of the species encountered in the BBS have increased somewhat in population over the period 1966 - 1996. This number indicates that approximately half of the species are increasing, half are declining, about what you expect due to chance.But, if you look over the results for individual species, there are more significant increases (and declines) than you would expect by chance, suggesting that the large-scale, long-term summary does not provide sufficient information for understanding bird populations. Large scale summaries just provide averages that can mask patterns at lower temporal and geographic scales. The BBS has data from over 421 species of birds, covers most of North America, and has been going on for over 31 years-hidden in our 51.5% are some species that are declining in population at a rapid rate, some time periods when many species showed decreasing (or increasing) populations, and some regions where a majority of species have declined. To understand and manage bird populations, we have to know how population change is associated with changes in features in the environment. The BBS can be used to identify species, time periods, and geographic areas that have declines, alerting conservationists to the possibility of the need for management action.
|
| Lists of Species With "Significant" Changes by Region | Here, we let you select a region, and provide you with a list of all species experiencing "significant" increases or declines over the interval of interest. | Click here for the list. |
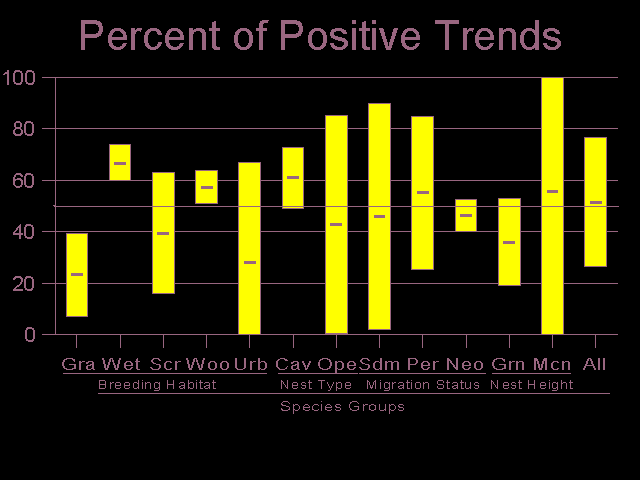
| Species group analyses: Often, it is useful to group species that share some common feature. We group birds based on attributes such as breeding habitat, nest type, migration status, and nest location. If species in the group show consistent trends, and differ from species not in the groups, it suggests that the common feature could be influencing population change for the group. For more discussion on this, click here. For a listing of the species in each guild, click here |
| Percentage of Increasing Species by Group | These "big picture" summaries are useful in identifying major patterns of population change, such as the long-term decline in grassland-breeding birds. Here, we calculate the percentages using the empirical Bayes method described in Link and Sauer (1996). | Click here for a histogram of the percentages by species group, along with 95% confidence intervals. Note that grassland-breeding birds are the only group showing consistent declines. |
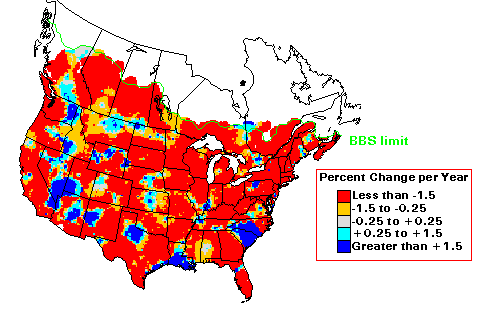
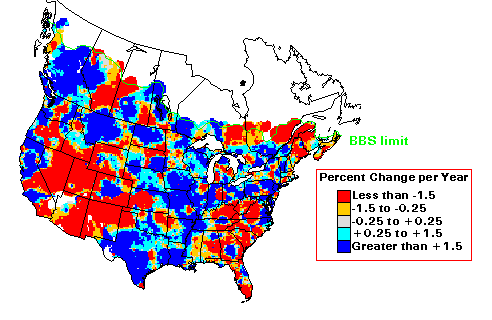
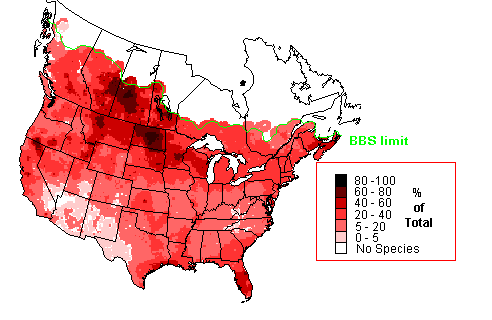
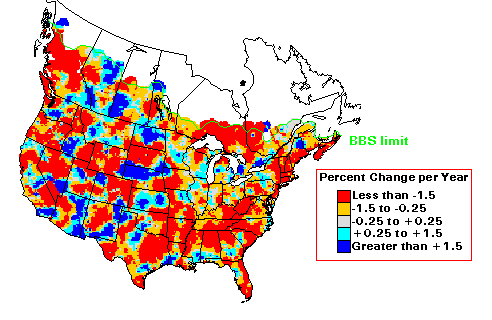
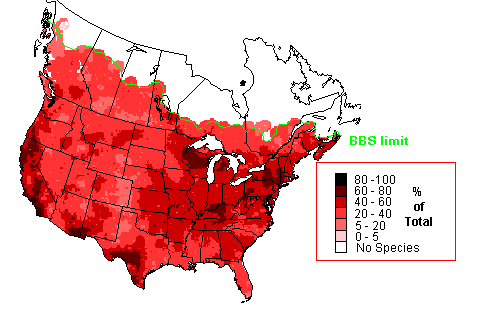
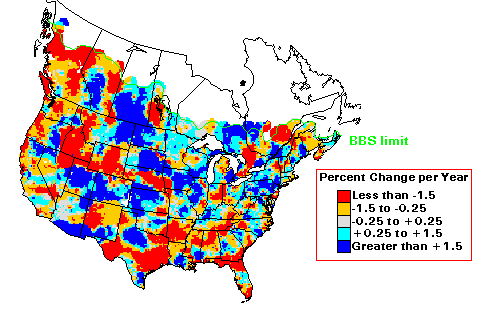
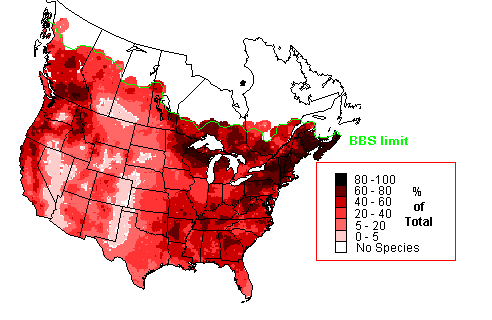
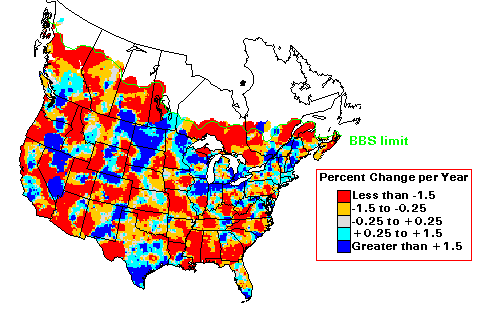
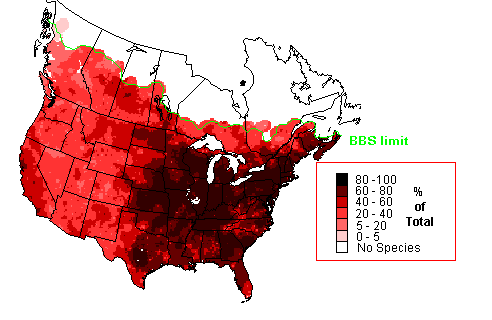
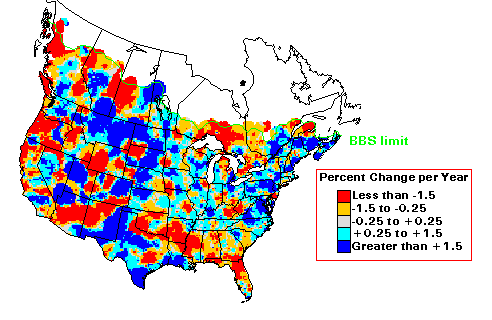
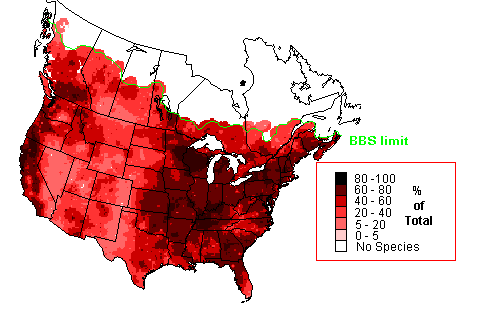
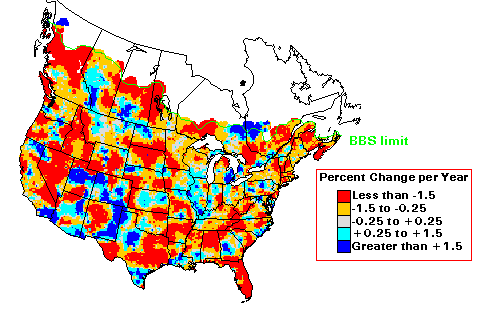
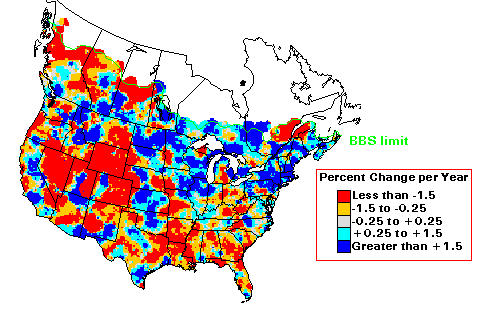
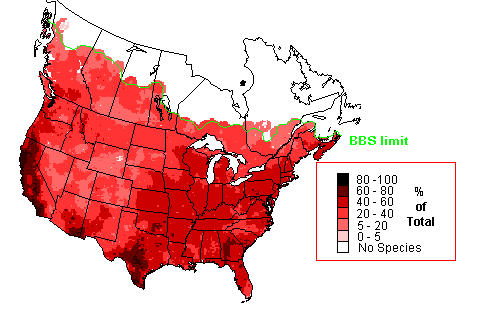
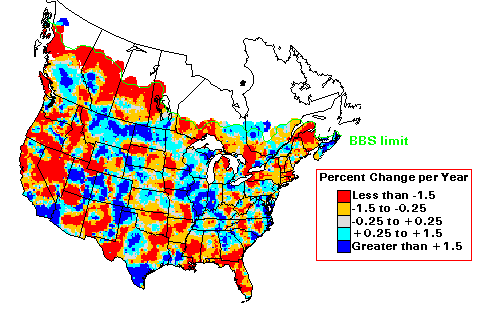
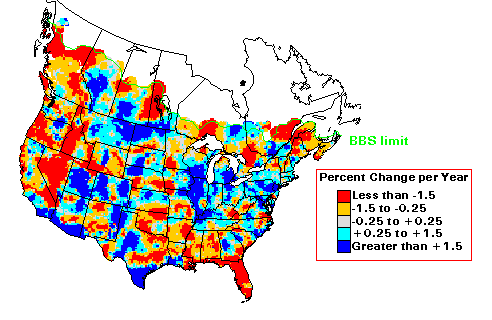
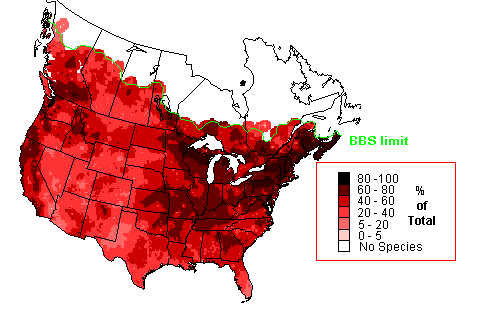
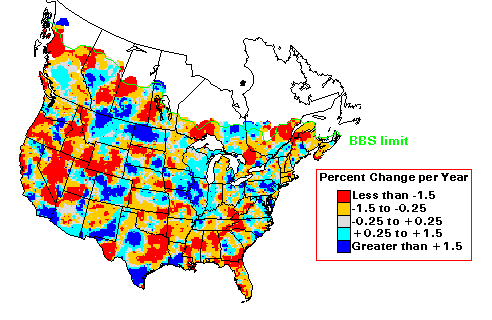
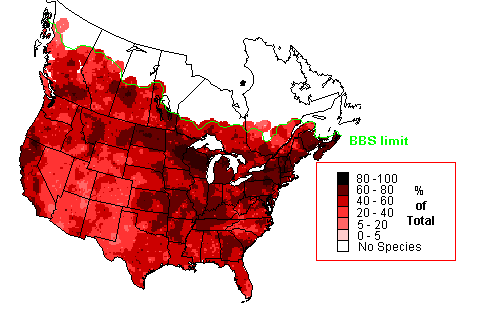
| Breeding Habitat Species Groups | (23.3 %**; N=28) Trend Map Species Richness Map |
(66.5 %**; N=86) Trend Map Species Richness Map |
(39.6 %; N=86) Trend Map Species Richness Map |
(57.4 %**; N=133) Trend Map Species Richness Map |
(28.3 %; N=14) Trend Map Species Richness Map |
| Nest Type Species Groups | (61.0 %; N=62) Trend Map Species Richness Map |
(Passerines and Cuckoos (43.0 %; N=184) Trend Map Species Richness Map |
| Migration Status (Landbirds and Hawks) |
(55.3 %**; N=92) Trend Map Species Richness Map |
(46.1 %**; N=107) Trend Map Species Richness Map |
(46.3 %; N=136) Trend Map Species Richness Map |
| Nest Location Species Groups (Passerines and Cuckoos) |
(36.1 %; N=117) Trend Map Species Richness Map |
(55.7 %; N=121) Trend Map Species Richness Map |
| All Species | Trend Map Species Richness Map |
Patuxent Wildlife Research CenterLast updated 4/23/97
12100 Beech Forest Road, Suite 4039
Laurel, Maryland 20708-4039 USA
Telephone: 301-497-5500 Fax: 301-497-5505
