
Summaries of Bird Population ChangeThe BBS has data from over 421 species of birds, covers most of North America, and has been going on for over 31 years. Summaries of the data are bound to be controversial, because they collapse information over species, space, or time. For example, it appears that rangewide, over the 31 years, about half (51.5 %) of the species have increased, about what you would expect by chance. But, this apparent overall stability hides many increases and declines. Sorting out these patterns is difficult, and here we provide some tools for analyzing the patterns of population change.
|
| Species group analyses: Often, it is useful to group species that share some common feature. We group birds based on attributes such as breeding habitat, nest type, migration status, and nest location. If species in the group show consistent trends, and differ from species not in the groups, it suggests that the common feature could be influencing population change for the group. For more discussion on this, click here. For a listing of the species in each guild, click here |
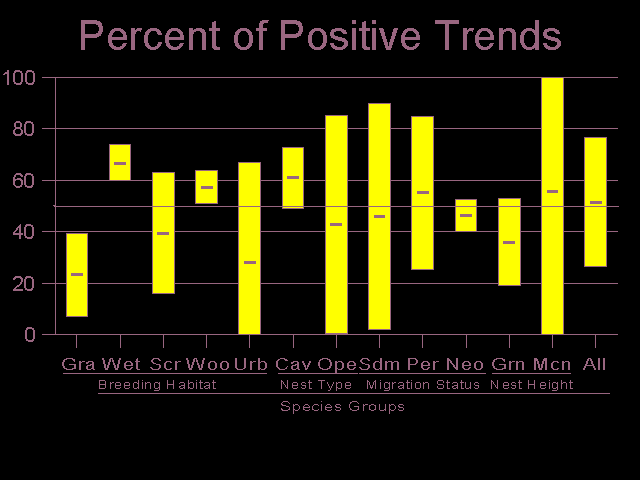
| Percentage of Increasing Species by Group | These "big picture" summaries are useful in identifying major patterns of population change, such as the long-term decline in grassland-breeding birds. Here, we calculate the percentages using the empirical Bayes method described in Link and Sauer (1996). | Click here for a histogram of the percentages by species group, along with 95% confidence intervals. Note that grassland-breeding birds are the only group showing consistent declines. |
| Detailed Regional Analysis of Population Change | Here, an interactive program provides summary information and ranked lists of trends for all species found in a selected region, time period, and species group. | Click here for the list. |
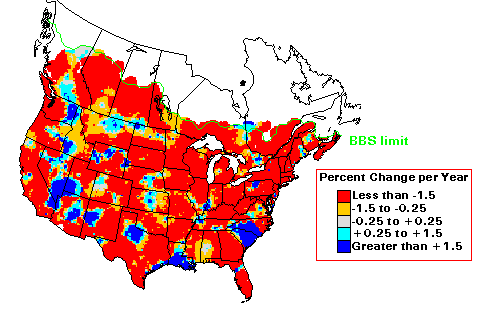
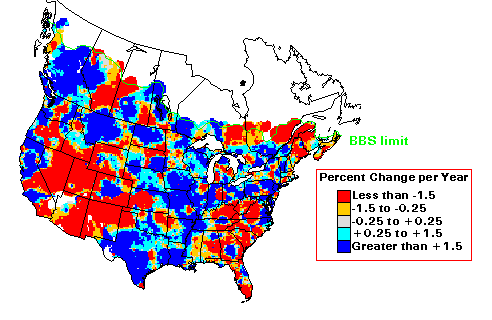
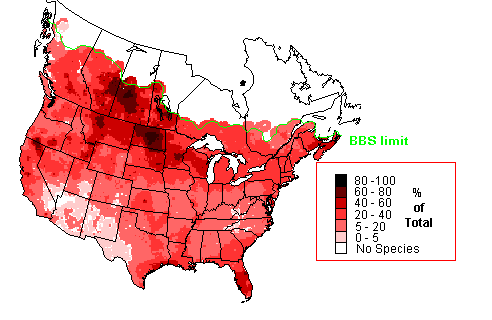
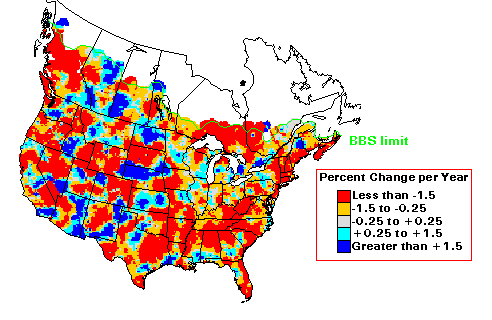
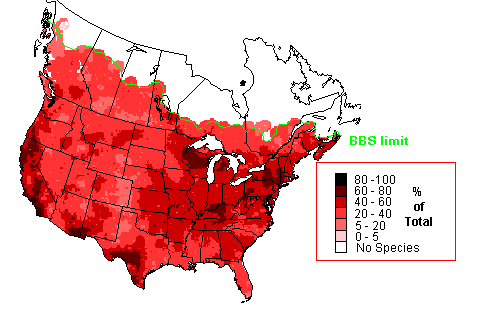
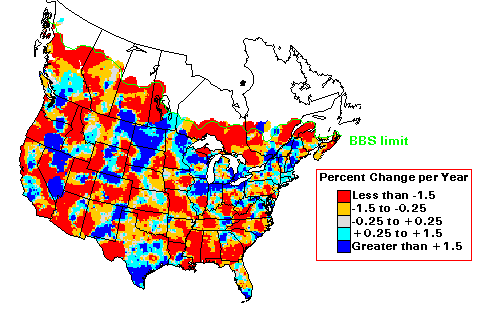
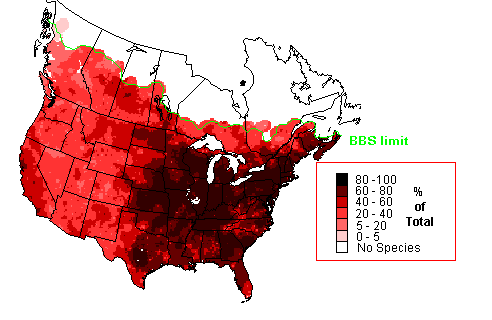
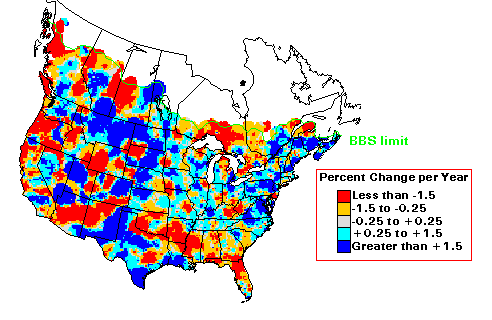
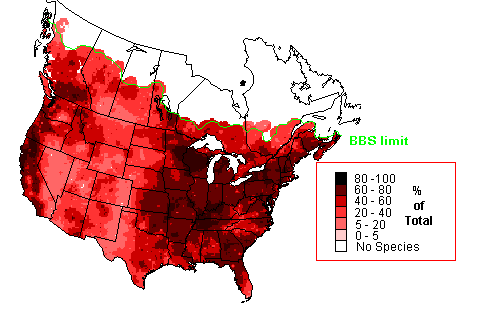
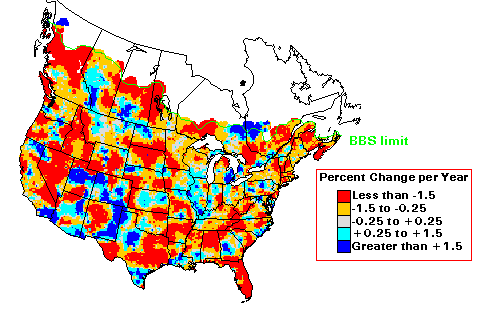
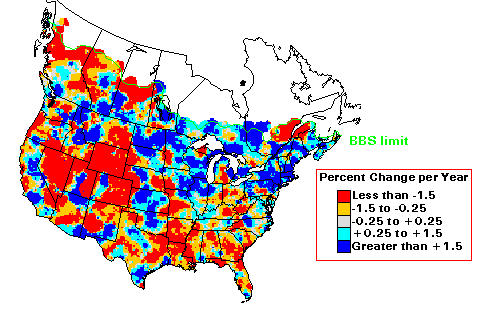
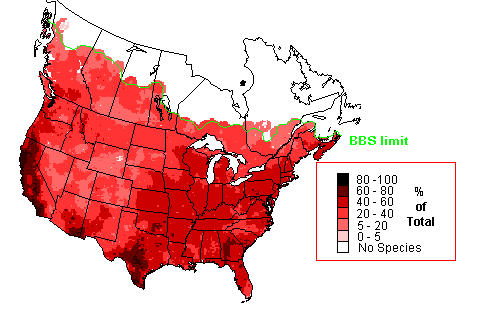
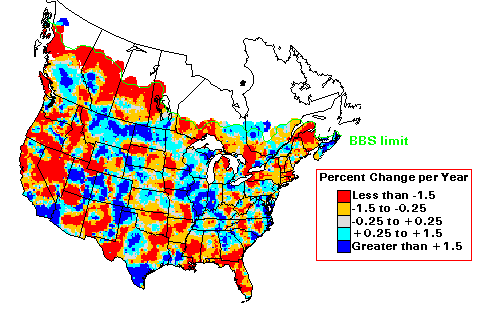
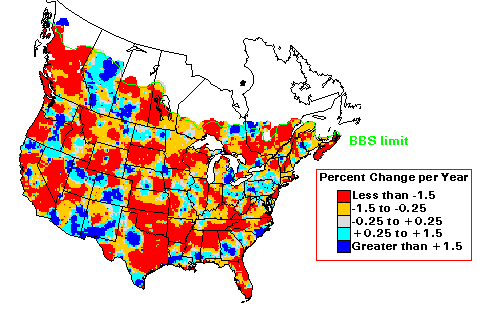
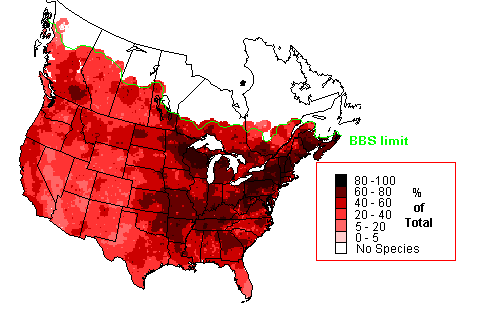
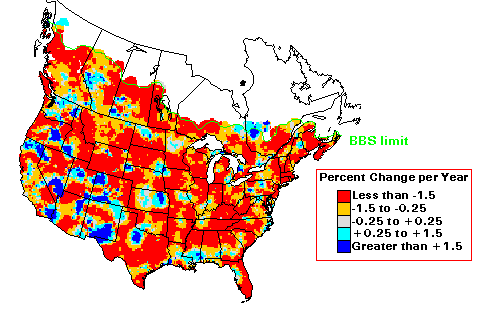
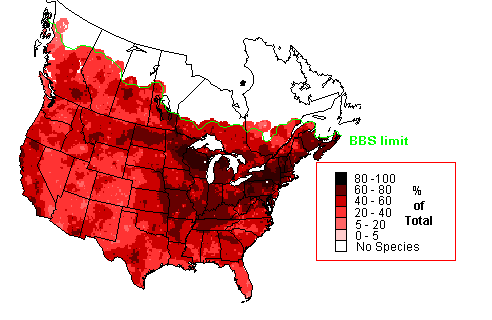
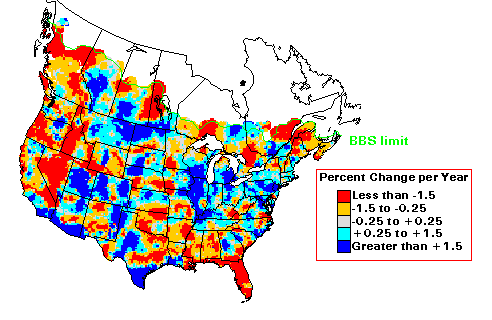
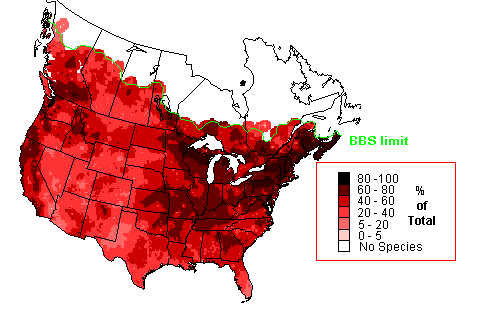
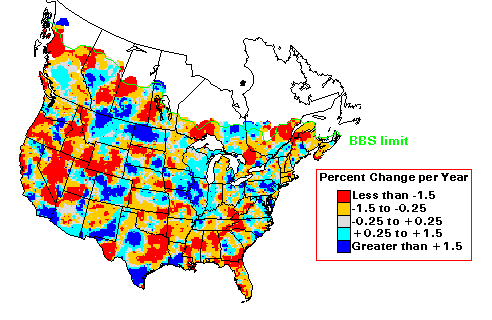
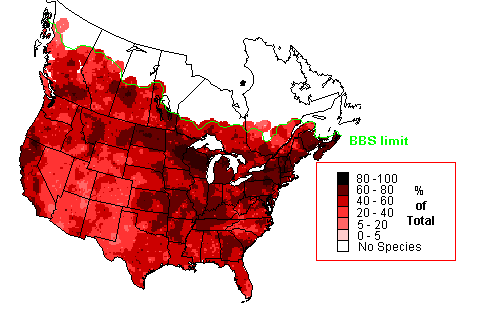
| Breeding Habitat Species Groups | (23.3 %**; N=28) Trend Map Species Richness Map |
(66.5 %**; N=86) Trend Map Species Richness Map |
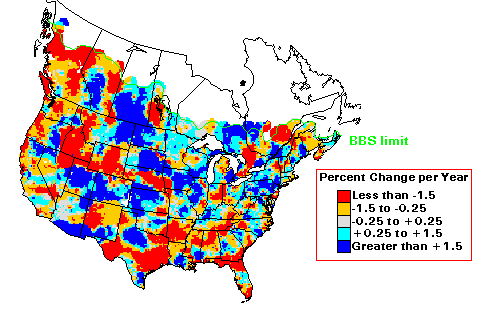
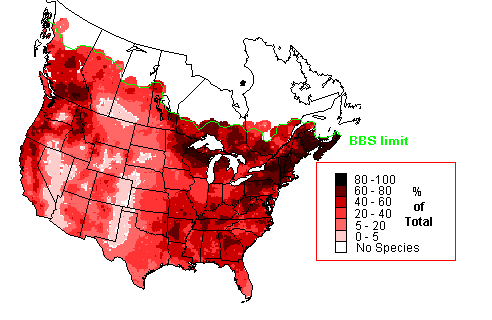
(39.6 %; N=86) Trend Map Species Richness Map |
(57.4 %**; N=133) Trend Map Species Richness Map |
(28.3 %; N=14) Trend Map Species Richness Map |
| Nest Type Species Groups | (61.0 %; N=62) Trend Map Species Richness Map |
(Passerines and Cuckoos (43.0 %; N=184) Trend Map Species Richness Map |
| Migration Status (Landbirds and Hawks) |
(55.3 %**; N=92) Trend Map Species Richness Map |
(46.1 %**; N=107) Trend Map Species Richness Map |
(46.3 %; N=136) Trend Map Species Richness Map |
| Nest Location Species Groups (Passerines and Cuckoos) |
(36.1 %; N=117) Trend Map Species Richness Map |
(55.7 %; N=121) Trend Map Species Richness Map |
| All Species | Trend Map Species Richness Map |
John R. SauerLast updated 29 July 1997
Patuxent Wildlife Research Center
11500 American Holly Drive
Laurel, Maryland 20708-4017 USA
E-mail: JRSauer@usgs.gov
