| Dedicated to
Chandler S. Robbins,
originator of the survey, to honor his 50 years of government service
|
Please cite this Page as:
Sauer, J. R., J. E. Hines, and J. Fallon. 2004.
The North American Breeding Bird Survey, Results and Analysis 1966 - 2003.
Version 2004.1.
USGS Patuxent Wildlife Research Center, Laurel, MD
Most Recent Update: 7 June 2004.
Technical notes:
(1) This is our first version of the 1966 - 2003 analysis. Remember the disclaimer!, and please let us know about errors or other
issues that limit the use and value of this site.
(2) There are probably a few species naming issues that lead to empty result pages. Please bring these to our attention,
and we will correct them.
(3) New maps (e.g., distribution maps) have been provided here. Older versions are still available, so please note the time periods covered by each set of maps.
(4) Some species are grouped for analysis. These are indicated on the selection lists.
(5) Earlier versions of the web site have been archived, and are accessible via links.
(6) In our view, lack of appropriate metadata is a critical limitation of use of survey data and results.
To initiate a discussion of metadata for bird surveys, we have included a link to metadata for this site and for BBS data.
Please comment on the appropriateness of these metadata!
General Information
Survey Results
Summary information on population change by region and time period
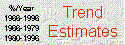
This program allows you to display trends for
3 time intervals, by species.
Indices are provided as links from the species names
This program allows you to display trends for
3 time intervals, by region.
Indices are provided as links from the region names
 Red-shaded Version Red-shaded Version
Blue-shaded Version
These are relative abundance maps, estimated
over the interval 1994-2003.
These are maps of population change, based on the 1966-2003 interval.
This link takes you to the population change analysis results
for bird conservation regions.
Interactive Checklists
This program allows you to estimate mean abundance from BBS
data for any species, at any location in the survey area. (This
now includes Alaska!)
|
|